ICP DECODE

The lab gives you numbers.
BioForge gives you the plan.

$39 one-time — not a subscription · included free with the Starter Kit

Not a chatbot. One deep read of your actual lab data, saved to a tank file that remembers every test after it.

Illustrative reef chemistry panel. Alkalinity is below the target range and is the priority correction. Example data — your report uses your own ICP results.

Alkalinity
7.1 dKH — reference range 8.0–9.0 — below range, priority correction
Calcium
412 ppm — reference range 400–450 — in range
Magnesium
1290 ppm — reference range 1280–1350 — in range
Nitrate
5.2 ppm — reference range 2–10 — in range
Phosphate
0.04 ppm — reference range 0.03–0.10 — in range
Correction
Raise alkalinity 1.4 dKH over 7 days: 7.7 mL per day at 50 gallons.

Your results took days to come back from the lab. Reading them takes two minutes.

Decode compares your ICP report against your tank type, salt brand, dosing method, livestock, and maintenance history — then ranks corrections by risk, not by what’s easiest to change.

11-section action plan · what to fix first · safe 7- and 30-day correction timeline
Generated automatically after checkout and emailed to you within minutes — not a queue, not a callback.
Why not just paste it into a chatbot?

You can, and people do. Four things go wrong, and all four are quiet.

Units. Labs report the same element in mg/L, µg/L, ppm and ppb, and some report phosphate where others report phosphorus. Read the number without reading the unit and you are off by a factor of a thousand, or by a factor of three. Decode canonicalizes every field against the lab that issued it before a single value is interpreted.

Non-detect is not zero, and neither is blank. “Not detected,” “<LOD,” “0” and an empty cell mean three different things. Flatten them and you get told an element is clean when it was never measured. Decode keeps them apart and says so.

Order, and dose. A chatbot hands you a list. Decode ranks by risk to livestock, so what can hurt something this week outranks what is merely out of range, and every dose is calculated against your actual water volume by the same calculator published on this site — not estimated in prose.

It knows where corrections go wrong. Lanthanum and fish gills. Pulling phosphate down faster than corals can follow. Dosing against a single trace reading that sits at the edge of what hobby ICP can resolve. Decode carries those limits and tells you to confirm on a second panel. A general model will give you a number and mean it.

These are not hypotheticals. Reef forums document chatbot dosing math that would have crashed tanks, and dosing histories a general model quietly misremembered mid-thread.

If you would rather paste it into a chatbot first, do that. Then run the same panel through Decode and compare the two. That comparison is the whole pitch.

Step 1
Run an ICP test
Reef Labs, Triton, ATI, Fauna Marin, or Oceamo. No test yet? Start here →
Step 2
Send Decode the results
Upload the lab file or paste your numbers. $39, one time.
Step 3
Get your ranked plan
7 and 30 day dosing steps, saved to your tank’s trend line.

Decode is one turn of the BioForge Loop: test anywhere, Decode writes your plan, Core+ ships it pre-measured.

BioForge interprets data you provide. Testing is performed by the lab. Results depend on tank conditions and execution.

One engine, four kinds of tank

Decode reads an SPS tank differently than a fish-only.

SPS dominant

Trace windows, alk drift, the metals that stall growth.

Mixed reef

Corrections ranked so one side never pays for the other.

LPS + softies

Forgiving, until a metal shows up.

FOWLR

No corals doesn’t mean no chemistry.

See it before you buy

Real output from the Decode engine. Unedited, sections 1 and 2 of 11.

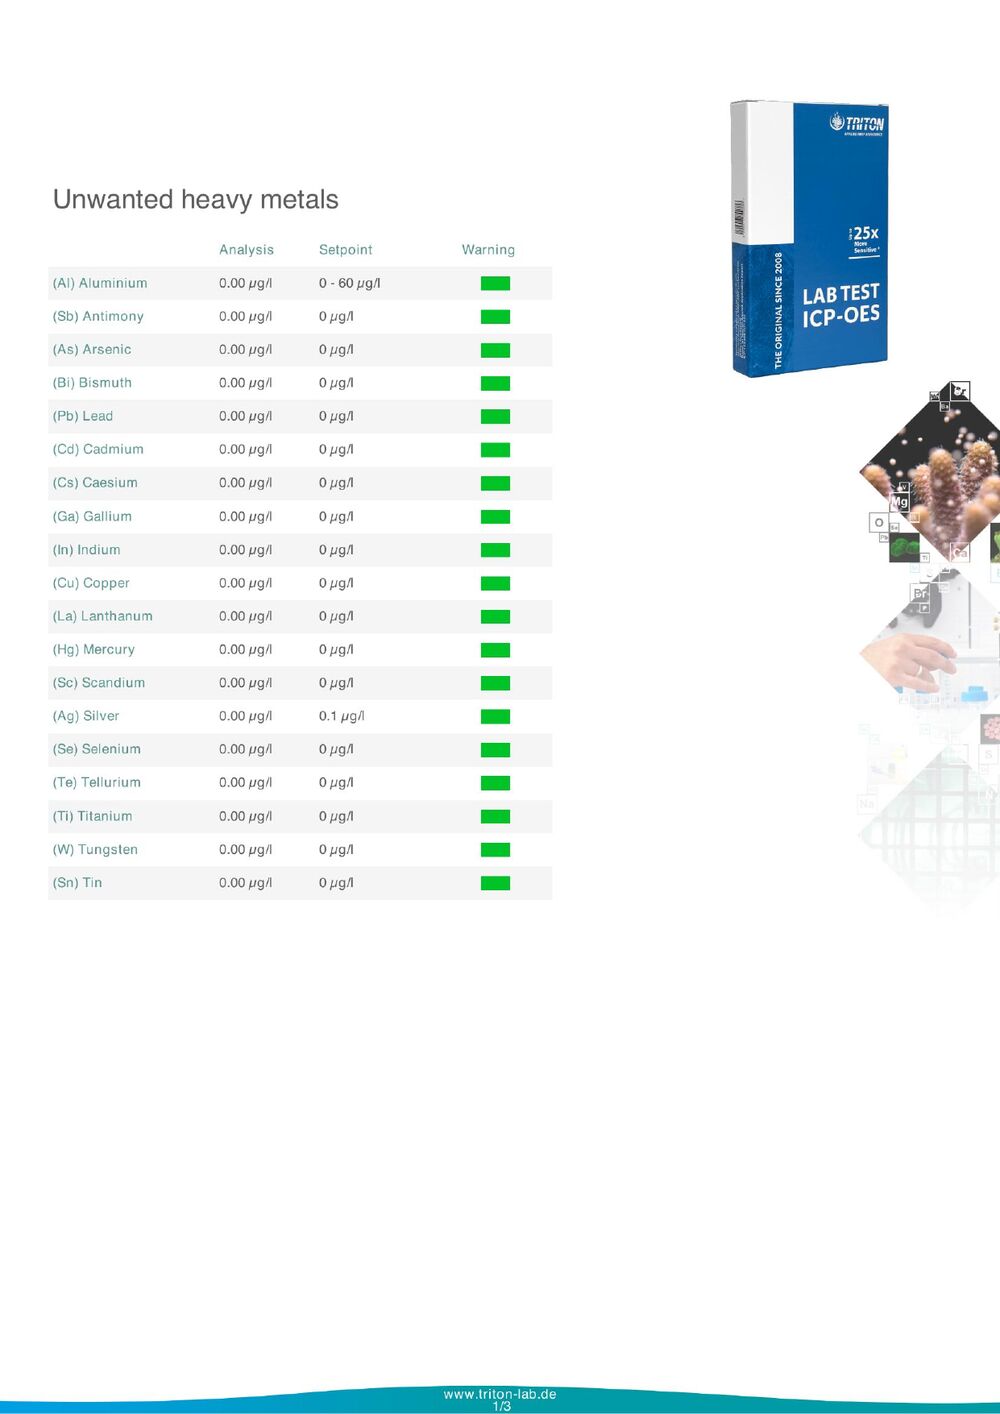
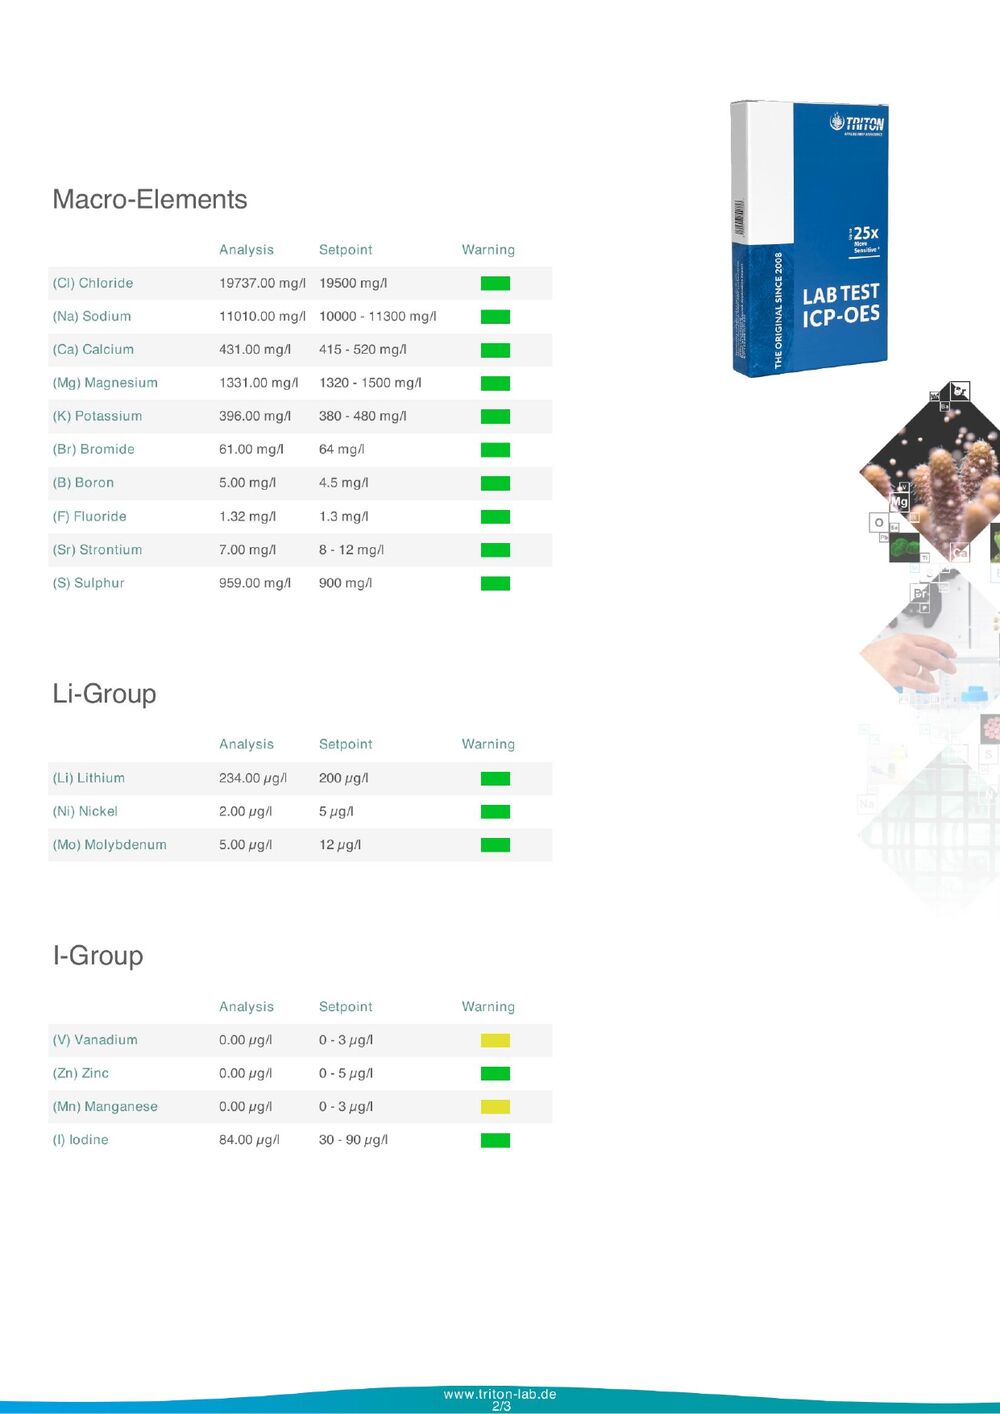
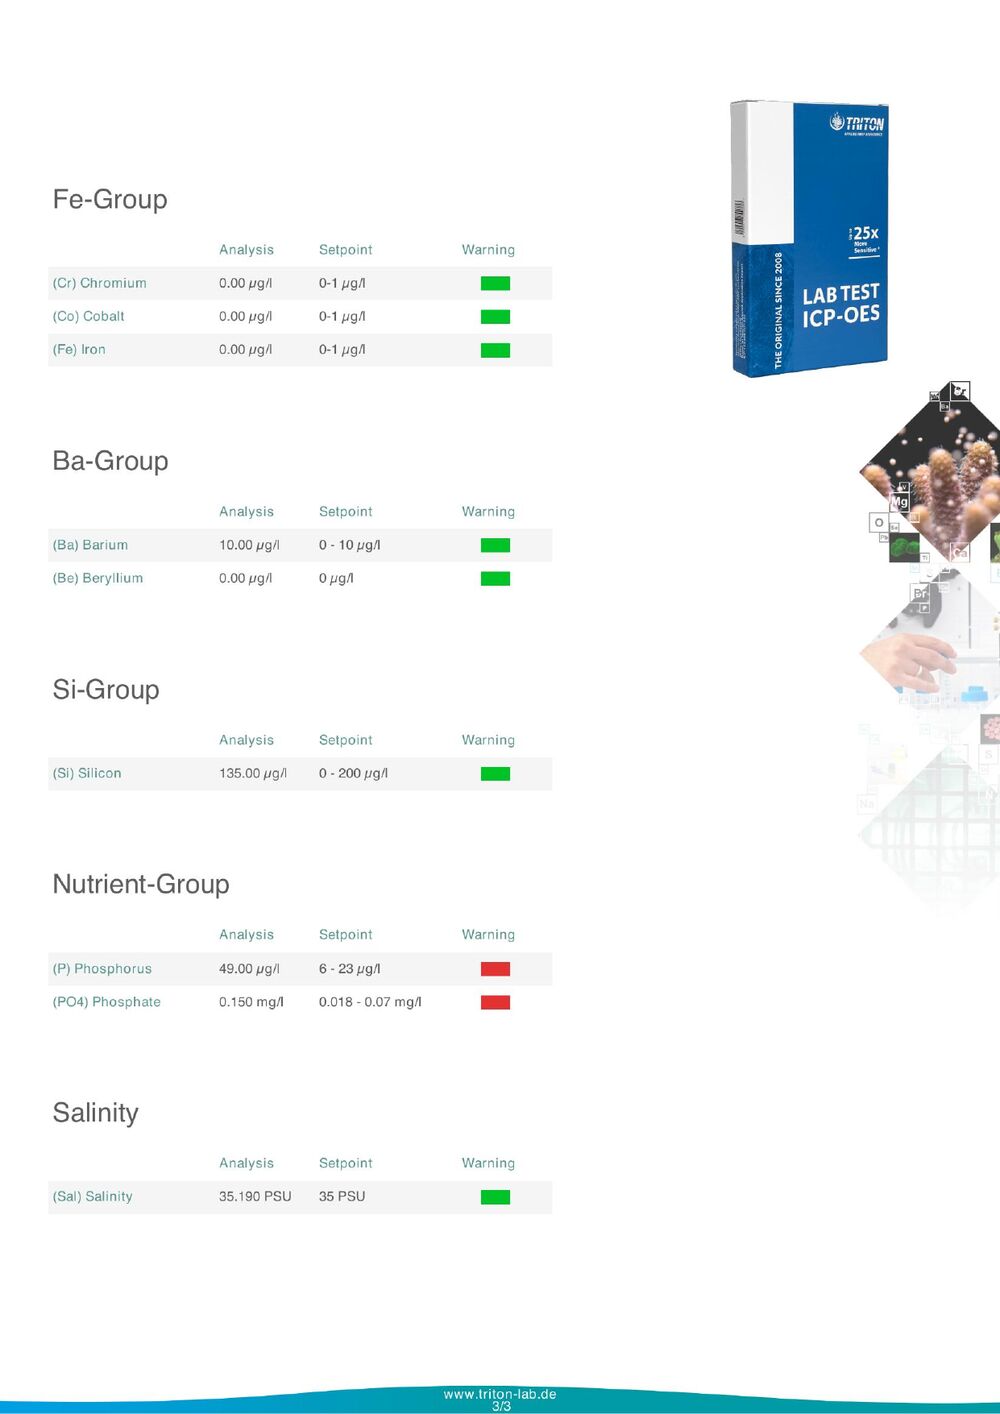
This is a real tank, not a demo. Read the lab report it was generated from → and check the numbers below against it yourself.

“A salt mix problem would drag other elements with it; an isolated aluminum spike in a tank running granular ferric oxide points at the media, so the media goes first.”

Section 01, unedited engine output. Every correction ships with its reasoning.
Sample report

Your ICP action plan.

IssuedMarch 2026
Decode typeFull Report
Sections11
01

Situation

Aluminum at 0.235 ppm, 11.75× above the safe upper limit. One priority. Everything else waits.

Your majors are not the problem: calcium, magnesium and alkalinity are all holding well, and potassium at 364 ppm is mildly deficient. Under any other circumstance potassium would be the thing to fix. It is not, because correcting a minor deficiency while a metal sits an order of magnitude over limit is how a tank gets slowly poisoned by a keeper who is busy being diligent.

Element Your tank Target Action
Aluminum 0.235 ppm < 0.02 ppm Stop GFO · 20% water change today
Potassium 364 ppm 380–420 ppm Hold until aluminum clears, then +5 ppm/day max

WHY: aluminum is 11.75× over limit while every major is in range. A salt mix problem would drag other elements with it; an isolated aluminum spike in a tank running granular ferric oxide points at the media, so the media goes first.

02

Urgent Risks · Fix Today

  • Stop GFO immediately. Granular ferric oxide is the most likely aluminum source in a system with this profile. Pull the reactor offline before the next dose of anything.
  • 20% water change today. Dilution is the only export path that acts on the same day. Match temperature, salinity and alkalinity to your current tank values, not to a target.
  • Do not resume phosphate media until a retest confirms clear. Restarting the source before you have confirmation is how the number comes back.
  • Potassium waits. When aluminum is clear, raise K no faster than 5 ppm per day. Retest in 30 days.

9 more sections in the full report: what matters, what to stop doing, correction order, safe dosing pace, water change plan, and a 7- and 30-day timeline.

FREE · NO ACCOUNT, NO EMAIL

Not ready for Decode? Run a free reading of your ICP numbers in our calculator, or take the method with you: a field guide to the four report groups, the µg/L trap, and the reading order that stops panic-dosing. Any lab.

Free ICP reading → Field guide PDF →
Case Study · Client Reef · Triton ICP-OES

Phosphate 8× over spec. A hair-algae takeover. Then a 74% drop.

One client's mixed reef was losing ground to green hair algae. A Triton ICP panel showed why, and Decode turned the numbers into a clear first move for the keeper to consider.

BeforeAlgae outbreak
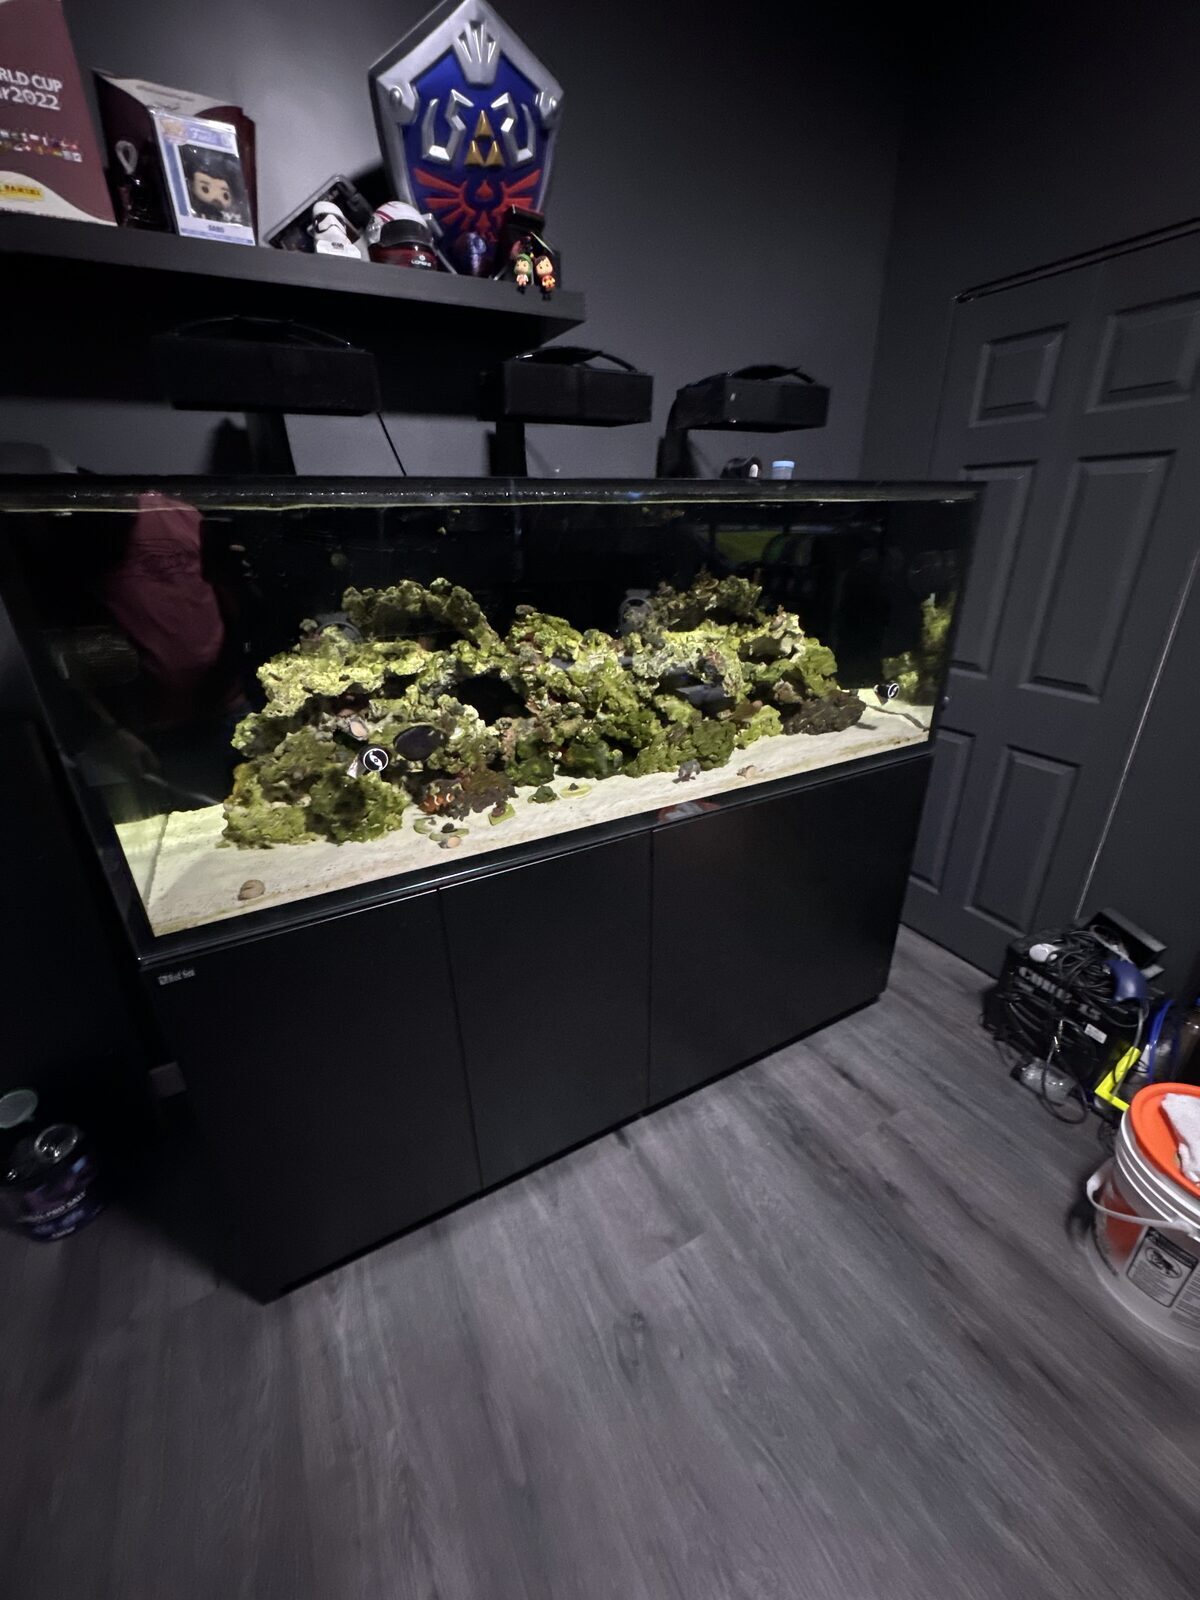
Hair algae outbreak · Jul 2024
AfterRecovered reef, algae cleared
Same tank, grown in · 2026
−74%
PHOSPHATE  0.581 → 0.150 mg/l  ·  TWO TRITON PANELS, SAME SYSTEM
Still above the 0.07 target. Better, not perfect. The algae cleared and the correction is ongoing. We show the real number, not a rounded one. One system, two panels, no control tank. Phosphate export, feeding and maintenance all moved over the same period, so this is a documented outcome on a single reef, not a controlled result we can promise you.
ElementBeforeAfterSetpoint
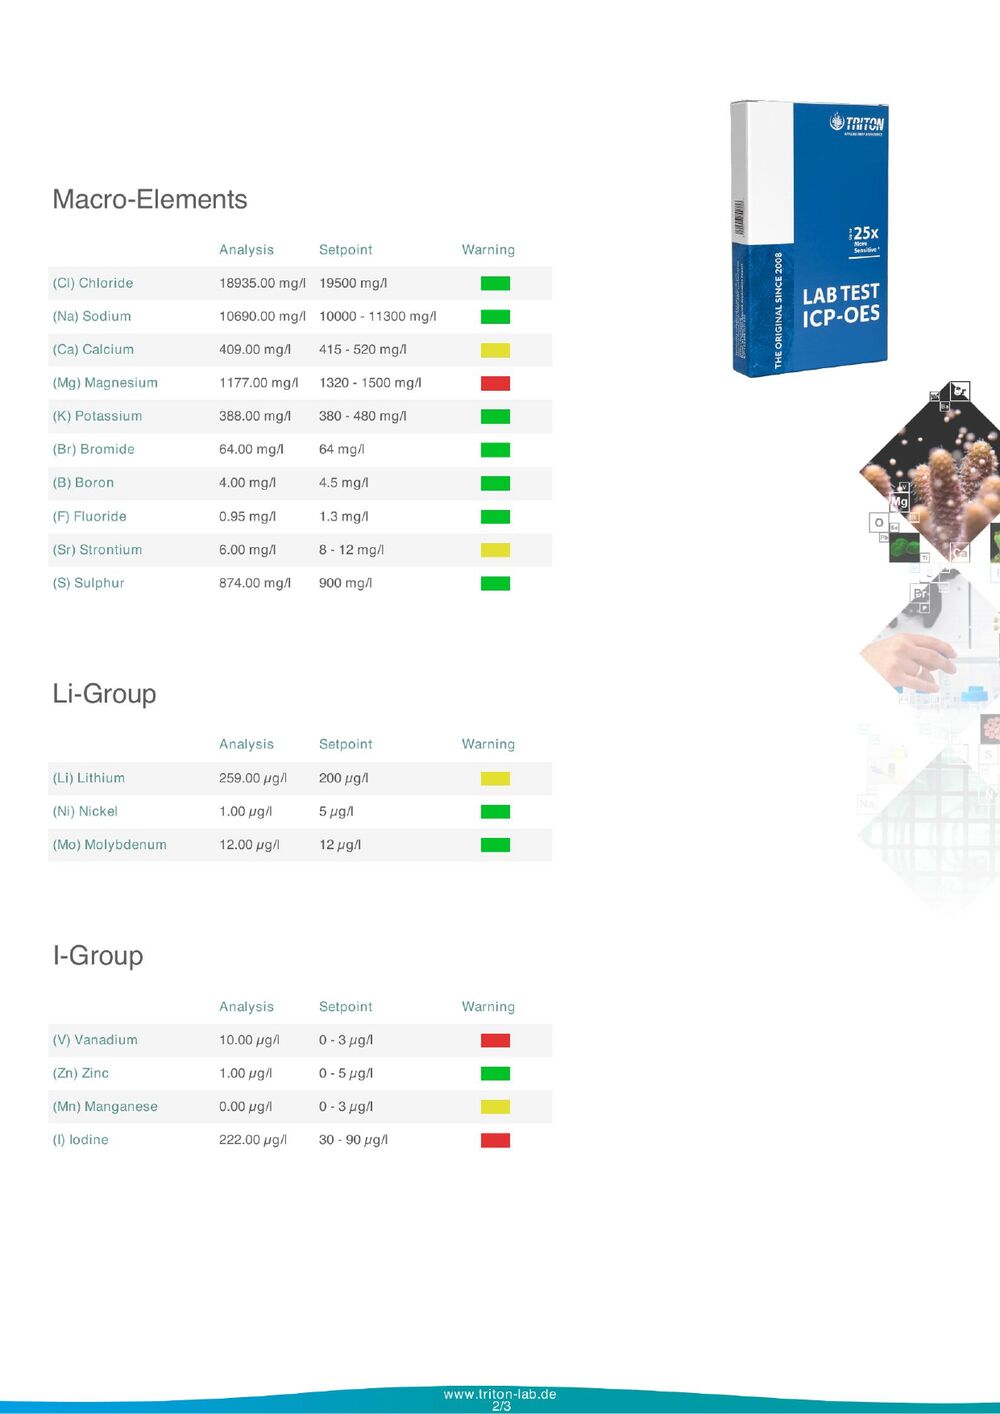
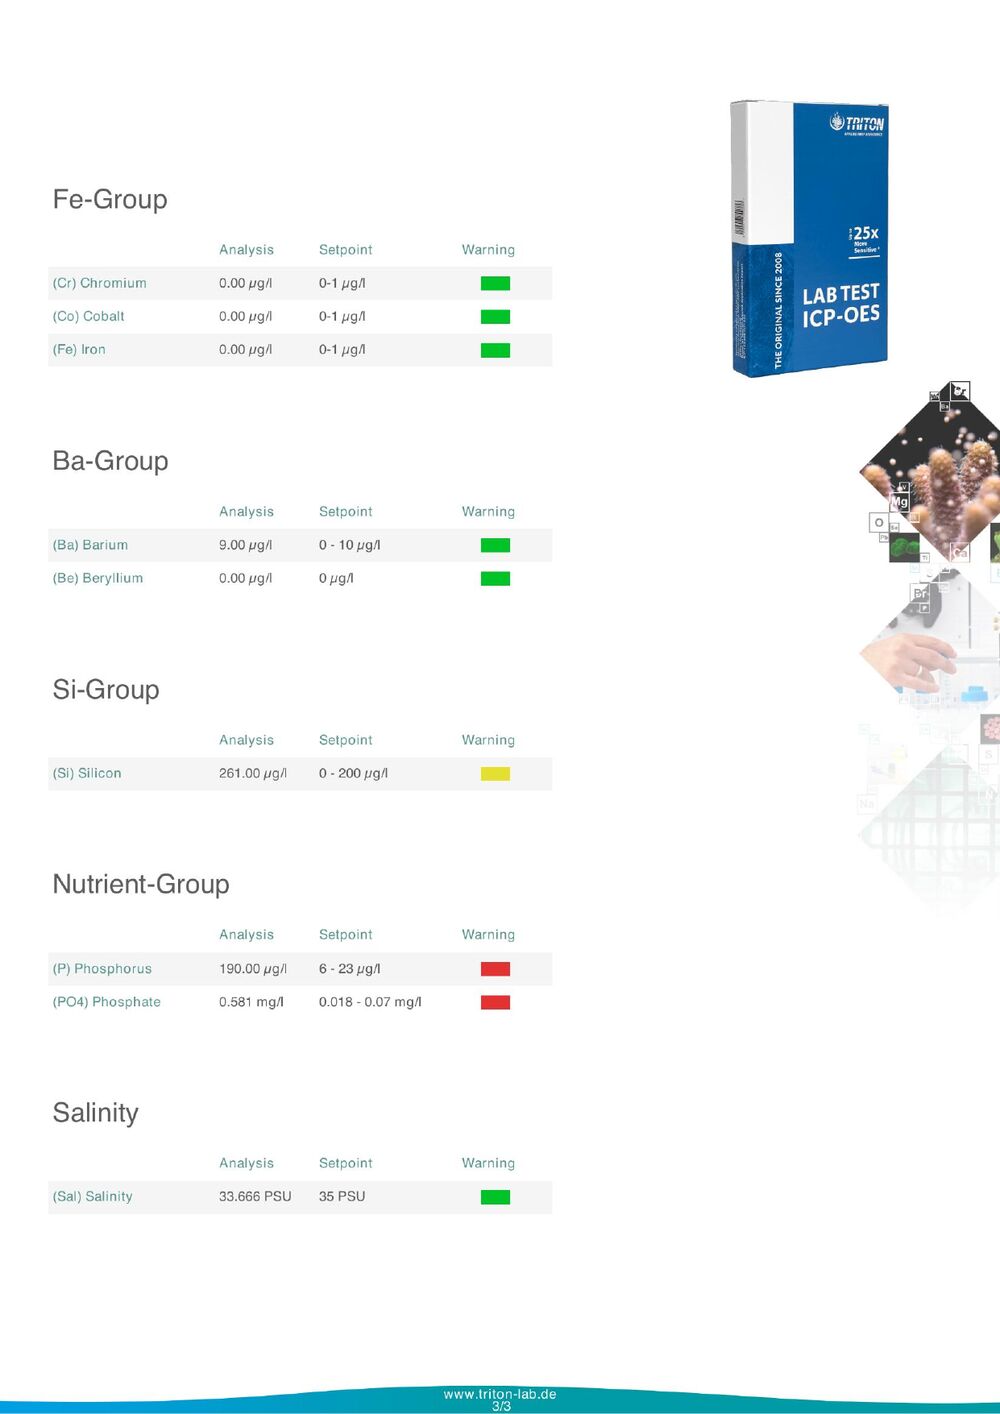
Phosphate0.5810.150 mg/l0.018–0.07
Phosphorus19049 µg/l6–23
Magnesium11771331 mg/l1320–1500
Vanadium10non-detect0–3
Iodine22284 µg/l30–90
Salinity33.735.2 PSU35
How to read this table. Non-detect means the element came back below the lab’s reporting limit, which is not the same as zero, so we print it as non-detect rather than “0”. Phosphate and magnesium are major parameters and reproduce well between panels. Vanadium and iodine are trace values measured in micrograms per litre, close enough to the limits of hobby ICP that a single panel can shift on sample handling or lab calibration alone. Treat the majors as measurements and the traces as signals worth confirming on a second panel before you dose against them.
What Decode suggested

Decode's analysis flagged phosphate running roughly 8× over setpoint as the likely driver of the algae. Among the options for bringing phosphate down, it suggested controlled, metered lanthanum chloride dosing run through a filter sock. The keeper chose to dose as directed and shared a follow-up panel: phosphate down 74%, algae receding. Other husbandry changes over the same period may also have contributed, and several other values moved back toward range as well.

If you dose lanthanum, dose it this way

Lanthanum chloride works by binding phosphate into lanthanum phosphate, a fine precipitate. That precipitate is the reason the method needs a safety envelope. Drip it slowly into a high-flow area ahead of mechanical filtration, never straight into the display, so the solids are captured in the sock rather than passing over gills. Change the sock often; a loaded sock stops capturing. Come down in stages over weeks rather than chasing the setpoint in one pass, because pulling phosphate down fast can stress corals that have acclimated to the higher level. Watch your fish for laboured or flared gill movement and stop dosing if you see it. Skip the method entirely on systems with delicate fish or weak mechanical filtration, and follow the dosing rate on the bottle you actually own, as concentrations differ between brands.

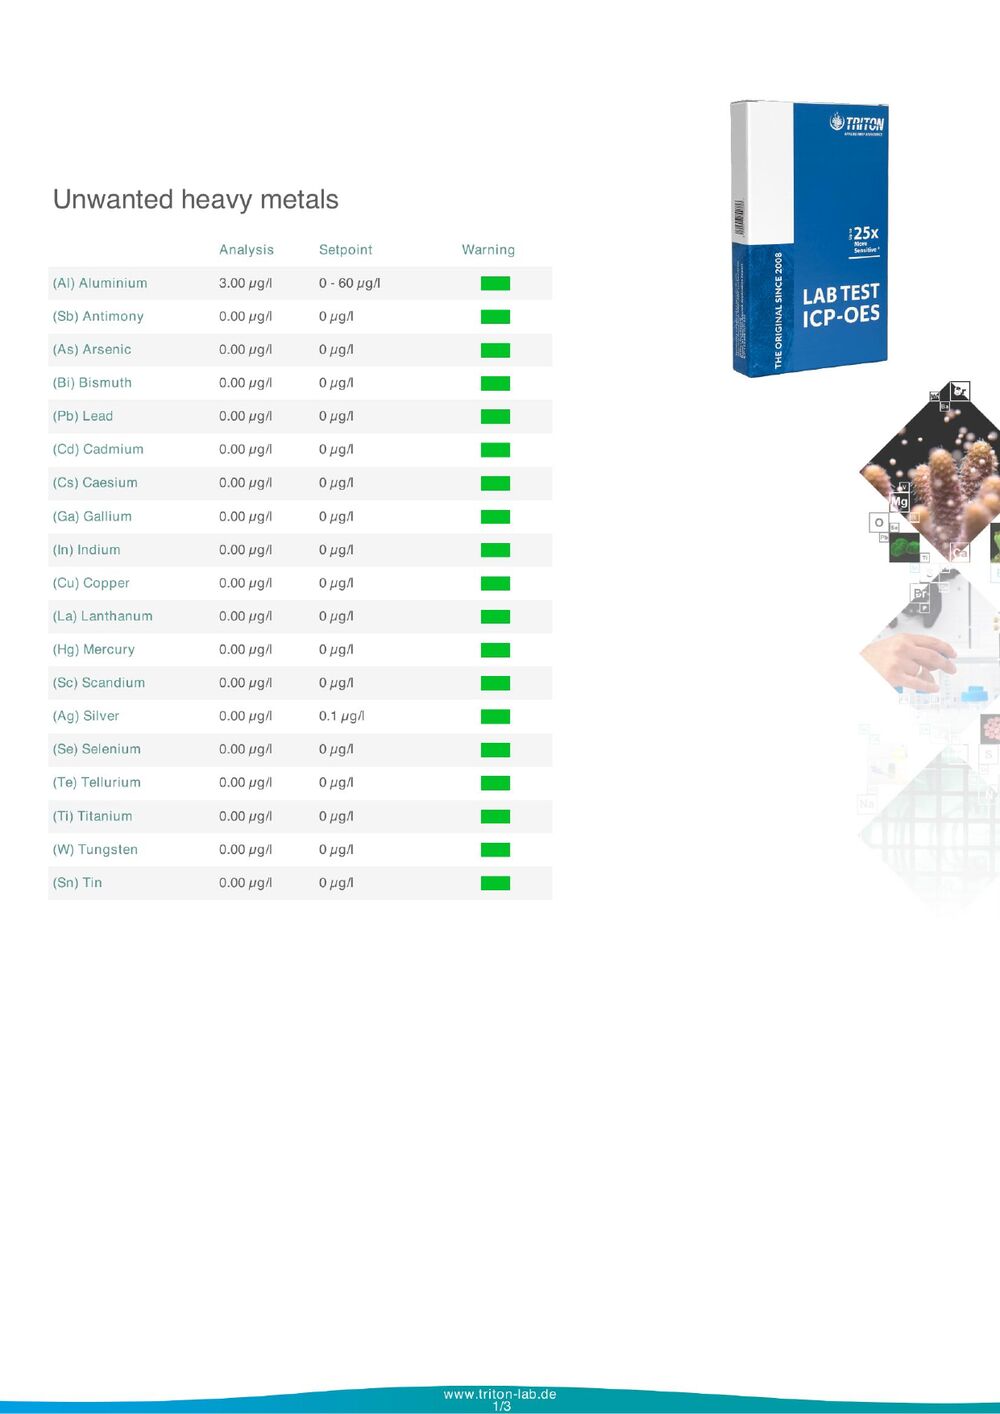
See the full Triton ICP-OES panels

Before · Baseline panel

Triton ICP panel, before, page 1 of 3 Triton ICP panel, before, page 2 of 3 Triton ICP panel, before, page 3 of 3

After · 30 Oct 2025

Triton ICP panel, after, page 1 of 3 Triton ICP panel, after, page 2 of 3 Triton ICP panel, after, page 3 of 3
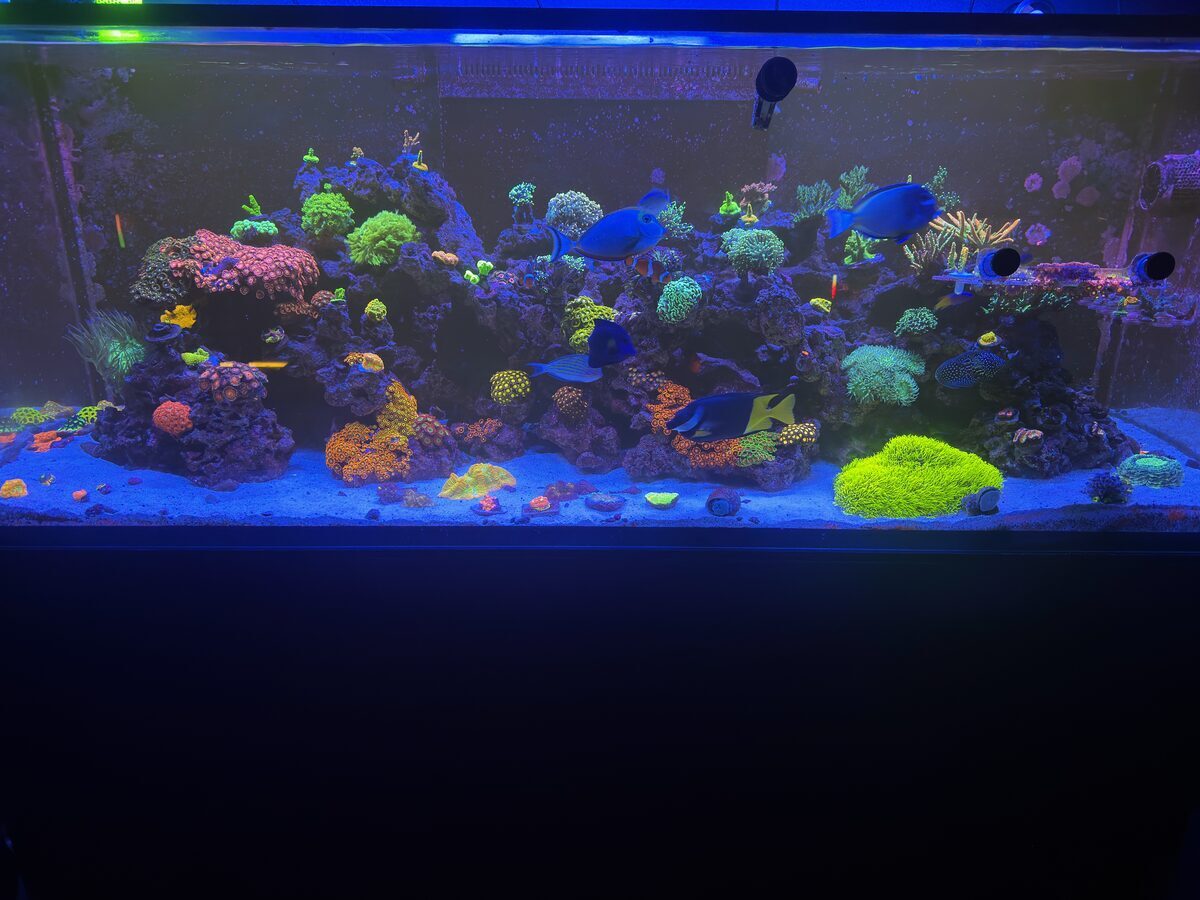
Unedited Triton ICP-OES reports for this client's system, shared with permission. The follow-up panel is dated 30 Oct 2025; the baseline panel was exported without its submission date. Photos illustrate the same system over time and were not taken on the ICP sampling dates.

Decode gives you analysis and suggestions. You make the final call for your tank. Results vary from system to system; this is one client's outcome, not a guarantee. When dosing any additive, follow the manufacturer's instructions.

Upload your Reef Labs Excel, paste any lab report as text, or enter values manually below.

REEF LABS · ICP-OES

Reef Labs: download Excel from your results page. Other labs: export PDF. Imports all 40+ elements.

US gallons (display volume)

If you test at home between ICP runs, enter the most recent values here. Leave blank if you rely on ICP only.

Upload what you can, tank overview, coral condition, algae growth, sump/equipment. The more context. The more precise the decode.

Drop photos here or click to select

Tank · sump · corals · algae, up to 8 images, 10 MB each
01Save your tank data 02Checkout unlocks & you pay 03Report delivered to your inbox
Decode Report

Your ICP, decoded.

$39 one-time
Starter Kit owners: your kit includes this — enter your BFKIT code at checkout and pay $0.

Your results run through BioForge's structured decode system and issued as a full 11-section action plan.

Why only $39? You already paid the lab for the expensive part, the measurement. Decode is the thinking layer on top of numbers you own. No lab, no shipping, no subscription to justify.

If the report arrives and simply isn’t useful to you, reply to your receipt and we refund it in full. You keep the report.

  • Full 11-section report
  • Urgent risks flagged first
  • 7 and 30-day correction plan
  • Dosing math calculated
  • Ready in minutes · delivered to your inbox
  • Saved to your account — every test builds your tank’s ICP trend history
  • Includes the ICP reading field guide (also free for everyone, no email)
↓ Click the button below to purchase
After checkout, your decode generates automatically — nothing to click, nothing to run.
Your data is already saved. Your report is emailed to you within minutes.
Report didn’t arrive? Re-run it here.

Your decode is emailed automatically after checkout. If it hasn’t shown up, enter the BioForge order number from your confirmation email to re-run it.

Don't have yours yet? Check your confirmation email. If you need help, contact hello@bioforgesystems.com.

We'll email your report here.

Not useful? Full refund. No fee, no forms — reply to your receipt.

Why this isn’t a guarantee

Every tank carries its own biological load, organic acid output, mucus production, trace mineral consumption, that changes how it responds to the same dose. Two tanks with identical ICP results can behave differently once a different mix of coral species and biomass is factored in. That variability is real, not fine print, which is why this report is a starting plan, not a fixed answer: dose based on what your data shows, then observe your tank and recalibrate, the same way any reef practitioner works with a moving target.

BioForge Decode is educational reef husbandry guidance based on customer-provided lab results, photos, and routine information. Output accuracy depends entirely on the accuracy of data you submit. BioForge is not responsible for results derived from incorrect or incomplete input. It is not a lab test, veterinary service, guarantee of livestock outcome, or emergency response. Always dose slowly, retest before and after changes, and watch your tank as closely as you watch the numbers. If you are experiencing a rapid crash or active livestock loss, contact your LFS or a reef specialist directly.

If a technical issue prevents your report from being delivered, email hello@bioforgesystems.com and we’ll make it right. And if the report arrives and simply isn’t useful to you, reply to your receipt and we refund it in full. You keep the report. We would rather lose the $39 than have you feel taken.

Your decode is being prepared.

Your report is typically ready in minutes. A copy will be sent to .

🐠

Preparing your decode…

Know a reefer who just got ICP results back?

Send them here. If they've been staring at a spreadsheet full of numbers and not sure what to do next. This is exactly what it's built for. You'll get $15 toward your next order if they complete a decode.

BioForge Decode. Complete

Your ICP action plan.

Issued
Decode type
Sections
Coming Soon. BioForge Pro

Chemistry + a monthly decode, on one subscription.

Your CORE+ refill and a Decode Report every month, bundled. Early pricing for the list.